Shareholder Return
Shareholder Return Status
- Payout ratio (b/a)
- Current net profit (a)
- Total amount of dividends (b)
| Classification | 2017 | 2018 | 2019 | 2020 | 2021 | 2022 | 2023 | 2024 | 2025 |
|---|---|---|---|---|---|---|---|---|---|
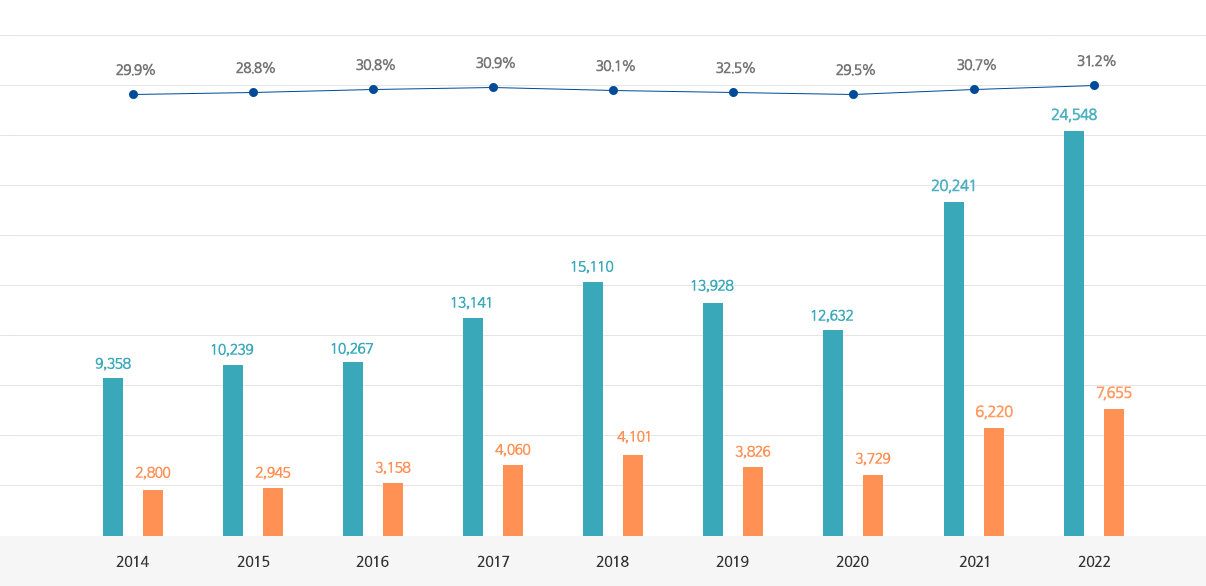
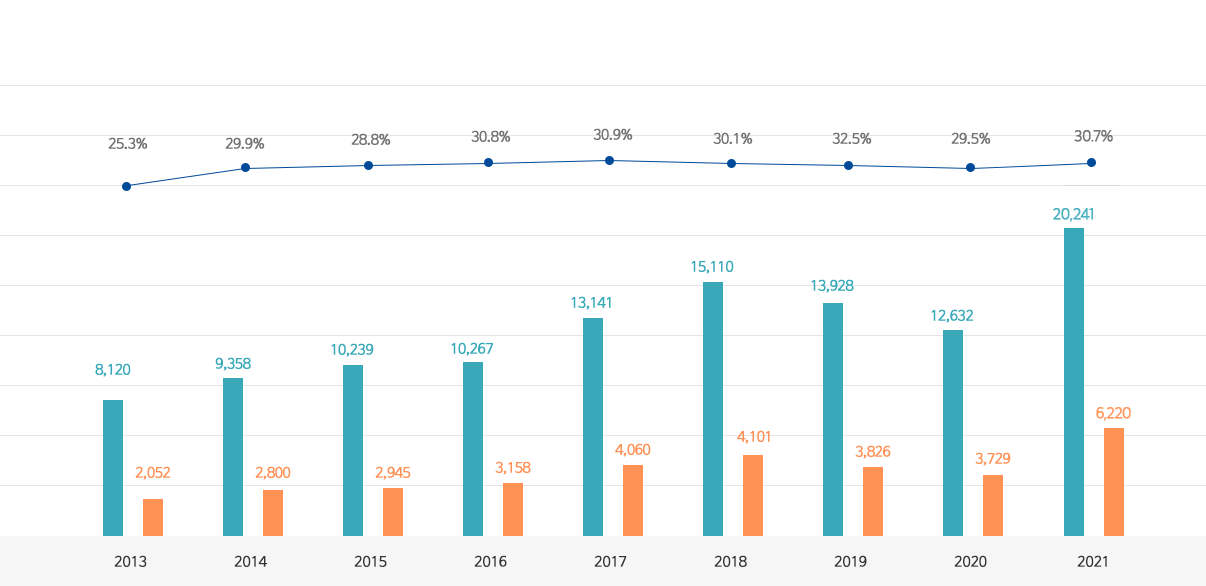
| Current net profit (a) | 13,141 | 15,110 | 13,928 | 12,632 | 20,241 | 24,548 | 24,115 | 24,281 | 23,858 |
| Total amount of dividends (b) | 4,060 | 4,101 | 3,826 | 3,729 | 6,220 | 7,655 | 7,847 | 8,493 | 8,357 |
| Payout ratio (b/a) | 30.9% | 30.1% | 32.5% | 29.5% | 30.7% | 31.2% | 32.5% | 35.0% | 35.0% |
| Dividends per share | ₩617 | ₩690 | ₩670 | ₩471 | ₩780 | ₩960 | ₩984 | ₩1,065 | ₩1,048 |
| Par value dividend ratio | 12.3% | 13.8% | 13.4% | 9.4% | 15.6% | 19.2% | 19.7% | 21.3% | 21.0% |
| Market value dividend ratio | 3.7% | 4.6% | 5.4% | 5.0% | 7.0% | 8.6% | 7.3% | 6.9% | 4.2% |
| Frequency and type | Annual (cash) |
Annual (cash) |
Annual (cash) |
Annual (cash) |
Annual (cash) |
Annual (cash) |
Annual (cash) |
Annual (cash) |
Annual (cash) |
| Classification | Status |
|---|---|
| Current net profit (a) | 2017: 13,141 2018: 15,110 2019: 13,928 2020: 12,632 2021: 20,241 2022: 24,548 2023: 24,115 2024: 24,281 2025: 23,858 |
| Total amount of dividends (b) | 2017: 4,060 2018: 4,101 2019: 3,826 2020: 3,729 2021: 6,220 2022: 7,655 2023: 7,847 2024: 8,493 2025: 8,357 |
| Payout ratio (b/a) | 2017: 30.9% 2018: 30.1% 2019: 32.5% 2020: 29.5% 2021: 30.7% 2022: 31.2% 2023: 32.5% 2024: 35.0% 2025: 35.0% |
| Dividends per share | 2017: ₩617 2018: ₩690 2019: ₩670 2020: ₩471 2021: ₩780 2022: ₩960 2023: ₩984 2024: ₩1,065 2025: ₩1,048 |
| Par value dividend ratio | 2017: 12.3% 2018: 13.8% 2019: 13.4% 2020: 9.4% 2021: 15.6% 2022: 19.2% 2023: 19.7% 2024: 21.3% 2025: 21.0% |
| Market value dividend ratio | 2017: 3.7% 2018: 4.6% 2019: 5.4% 2020: 5.0% 2021: 7.0% 2022: 8.6% 2023: 7.3% 2024: 6.9% 2025: 4.2% |
| Frequency and type | Annual(cash) |